Quinn Günther · 15 November 2026
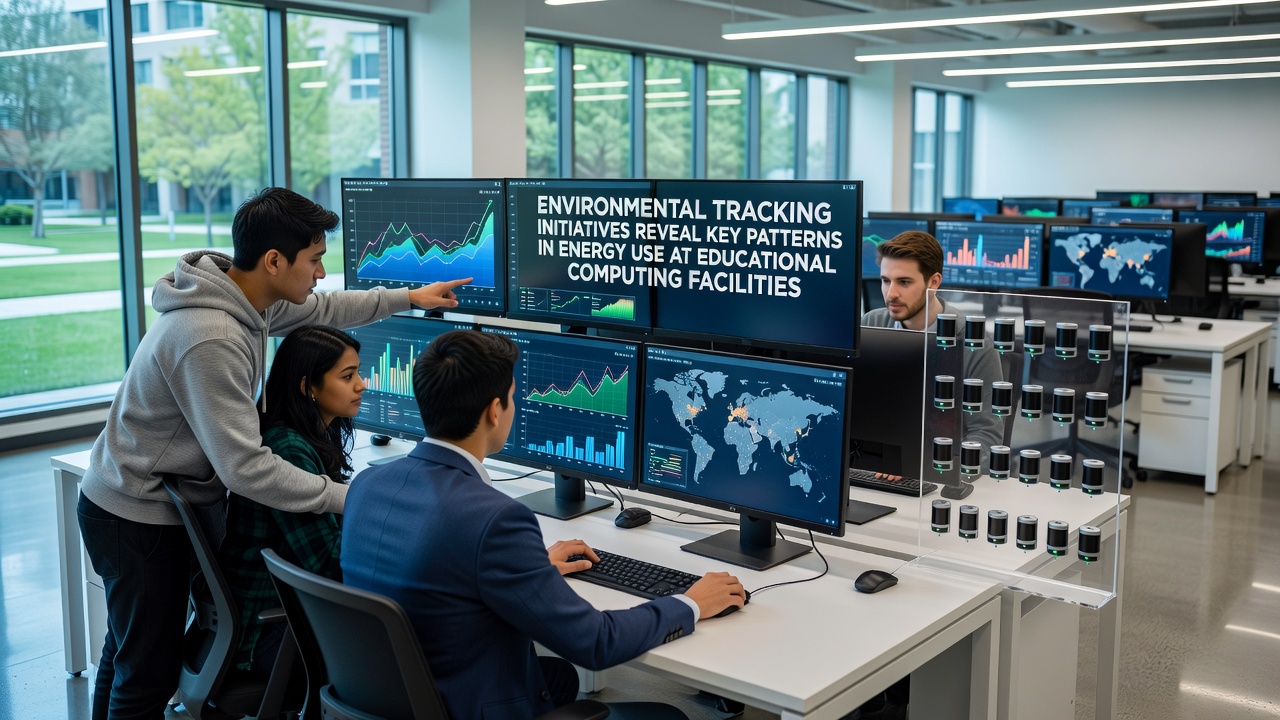
Environmental Tracking Initiatives Reveal Key Patterns in Energy Use at Educational Computing Facilities
Environmental tracking programs at educational computing facilities have started to map out consistent energy consumption trends across university data centers and research labs, and researchers have documented these patterns through continuous sensor networks that record power draw, cooling loads, and equipment utilization rates over multi-year periods. Data collected from institutions in North America and Europe shows that computing workloads often spike during academic terms, with baseline energy use remaining elevated even during breaks because of always-on infrastructure such as storage arrays and network switches.
Monitoring Systems Deployed Across Campuses
Facilities teams have installed granular metering devices on individual servers, HVAC units, and uninterruptible power supplies, which allows operators to correlate energy spikes with specific research jobs or teaching schedules. According to reports from the U.S. Department of Energy, educational institutions that adopted such systems recorded average reductions in peak demand after adjusting scheduling policies and upgrading to more efficient processors. The same datasets indicate that cooling accounts for roughly 35 to 45 percent of total facility energy in older buildings, while newer facilities with liquid cooling loops report lower shares because heat is removed more directly from processor components.
Seasonal and Workload-Related Patterns Identified
Analysis of logs gathered through 2025 and into November 2026 reveals that energy intensity rises sharply in the weeks leading up to final examinations and grant submission deadlines, yet overall daily averages stay surprisingly stable because background services continue running. Observers note that virtual machine density per physical host influences these figures more than raw user counts, since idle virtual instances still consume memory and network resources. One multi-campus study coordinated by Canadian research networks found that shifting non-critical batch jobs to off-peak hours lowered evening demand by measurable margins without extending project completion times.
Regional Comparisons and Data Sources
European academic consortia have published parallel findings that emphasize differences in climate zones, with northern facilities spending less on cooling than southern ones during summer months. Figures released by the Australian Renewable Energy Agency highlight how on-site solar arrays at several universities offset daytime computing loads, particularly when paired with demand-response controls that throttle non-essential workloads. These cross-regional datasets help administrators benchmark their own sites against peers that share similar research profiles and hardware generations.
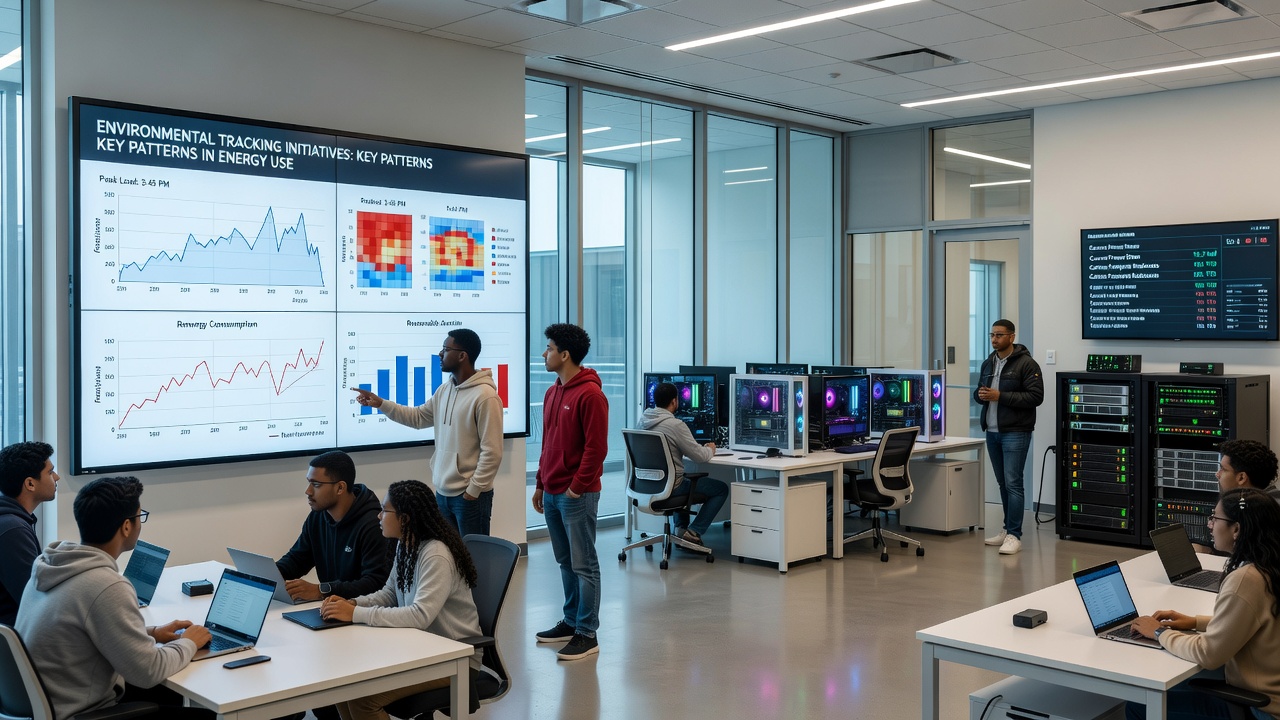
What's interesting is how storage growth continues to drive steady increases in baseline power even when processor efficiency improves year over year. Hard disk arrays and solid-state drive farms require constant power for redundancy and backup replication, and the expansion of research data repositories has added measurable load that was not fully anticipated in earlier efficiency models. Universities that implemented automated tiering policies, moving infrequently accessed files to lower-power media, recorded slower growth rates in their overall energy curves.
Impact of Hardware Refresh Cycles
Hardware replacement programs also appear in the tracking data as inflection points where energy per computation drops, yet the absolute energy totals may not fall if the volume of work expands at the same time. Facilities that tracked both metrics side by side discovered that gains from newer CPUs were partially offset by increased GPU usage in machine-learning projects, which consume significantly more power under load. Researchers documented these shifts through before-and-after comparisons at sites that staggered their refresh schedules over several fiscal years.
Conclusion
Continued expansion of environmental tracking at educational computing facilities is expected to refine these patterns further, particularly as more institutions integrate real-time dashboards that combine energy data with job scheduler outputs. The resulting datasets support planning decisions about capacity expansion, renewable procurement, and targeted efficiency upgrades while providing transparent records for regulatory and funding requirements. As monitoring coverage widens, administrators gain clearer views of how academic calendars, research priorities, and technology choices interact to shape overall energy demand.